
AT&T Inc. (NYSE:T) and Verizon Communications Inc. (NYSE:VZ) are two classic dividend income plays. However, not all dividend yields are created equal – differences in growth rates, competitive advantages, balance sheet health, and more can significantly alter the riskiness of a dividend and a stock’s total return potential. While T and VZ might have looked fairly similar several years ago, they have started to diverge in a pretty significant way.
Read on to learn why VZ is a core holding in our Top 20 Dividend Stocks portfolio but T does not make the cut. To view the full dividend data we used to analyze VZ and T, please click here.
Business Overview
VZ is the biggest wireless service provider in the US, with its 4G LTE network available to over 98% of the US population. Wireless operations account for about 70% of total sales and 95%+ of opertaing profits (30%+ operating margin business). Wireline accounts for the remainder and primarily includes broadband video and data and traditional voice services.
T’s business was more balanced between wireline and wireless. In fiscal year 2014, wireless accounted for 56% of its sales and 75% of its income (low-to-mid 20% operating margin). Wireline made up the remainder of the business. However, the company’s $49 billion bid for DirecTV was recently approved and will make T the largest pay TV provider in the world once it closes. T hopes bundling internet, mobile, and TV on one bill will separate it from competitors. Its exposure to wireless will be reduced.
Stock Performance
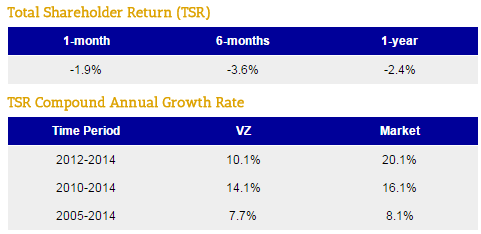
Not surprisingly, VZ failed to keep up with the market over the past three years, compounding at 10% compared to the market’s 20% CAGR. Over longer periods, VZ has performed about in line with the market.
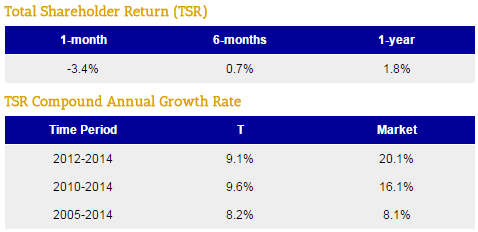
T’s long-term performance has been similar to VZ’s, although it has faired significantly worse over the last five years (9.6% CAGR vs VZ’s 14.1% CAGR):
Dividend Analysis
We analyze 25+ years of dividend data and 10+ years of fundamental data to understand the safety and growth prospects of a dividend. A stock’s long-term dividend and fundamental data can all be seen here.
Dividend Safety Score
Our Safety Score answers the question, “Is the current dividend payment safe?” We look at factors such as current and historical EPS and FCF payout ratios, debt levels, free cash flow generation, industry cyclicality, ROIC trends, and more.
Verizon
VZ scored an impressive 94 Safety Score, suggesting its dividend is safer than 94% of all other dividend stocks.
Factors contributing positively to VZ’s score are its large size, generally stable industry (sales were flattish during the recession), modest payout ratios, and consistent returns on invested capital. While VZ’s debt load jumped with its $130 billion deal to acquire the remaining 45% of Verizon Wireless, it is still a very healthy business.
One of the first places to look to evaluate a dividend’s safety is the payout ratio. Earnings are generally more volatile than free cash flow, so we like to look at the free cash flow payout ratio in addition to the EPS payout ratio. Over the trailing twelve months, VZ’s free cash flow payout ratio is a healthy 49%, consistent with levels observed over the past decade.

We can see that VZ generated free cash flow each year and has demonstrated an ability to grow free cash flow per share as well:

The company’s operating margins remained in the low-to-mid teens for most of the past decade:

However, with VZ’s acquisition of the remaining 45% of Verizon Wireless, mix has shifted significantly into higher-margin wireless operations. As seen below, operating margins over the past several quarters have been in the mid-20s:

From a credit perspective, VZ’s balance sheet could be better. The company will work on paying down debt from the Verizon Wireless deal in coming years and has recently sold off some wireline assets for $10 billion to help. Long-term debt to capital stood at 0.89 at the end of Q2, but the company’s cash generation makes its financial standing look better – net debt / trailing 12-mo EBIT was a reasonable 5.4x given the stability of VZ’s cash flow.

AT&T
T’s Safety Score is 44, meaning its dividend’s safety rating is about in line with all other dividend-paying stocks.
T scored lower than VZ for several reasons. The company’s payout ratios are generally higher and more volatile, its returns on invested capital have been lower, and its growth has been more lackluster.
Over the last four quarters, T’s free cash flow payout ratio was 78%. While not at an extreme level yet, T’s elevated payout ratio is something to be aware of if underlying growth stalls (harder to grow the dividend). T’s payout ratio has been meaningfully higher than VZ’s for most of the last decade:

From a growth perspective, T has also struggled to grow free cash flow per share as quickly as VZ. In fact, free cash flow per share was lower in fiscal year 2014 than it was in fiscal year 2005 as T needed to increase its investments:

T’s operating margins were similar to VZ’s until recent years when VZ chose to move more into higher-margin wireless and T will pickup DirecTV’s business (mid-teens margins).

From a balance sheet perspective, it should be noted that T’s deal to acqure DirecTV is not yet reflected in its financials until next quarter. The impact will be about a $30 billion increase in net debt, putting its balance sheet in similar territory with VZ’s. While both business models can handle extra leverage compared to the typical company, it would be prudent for them to reduce debt in coming years.

Dividend Growth Score
Our Growth Score answers the question, “How fast is the dividend likely to grow?” It considers many of the same fundamental factors as the Safety Score but places more weight on growth-centric metrics like sales and earnings growth and payout ratios.
Verizon
VZ’s Growth Score is 39, meaning its dividend’s growth potential ranks below the average dividend stock’s growth potential (a score of 50 is “average”).
As seen below, VZ’s dividend has grown 2-3% per year over almost all time periods during the last 10 years. With expectations for low-single digit growth going forward and a balance sheet that could use some deleveraging, the company’s dividend growth prospects are moderate at best.

AT&T
T’s Growth Score was 8, again suggesting very low dividend growth rates going forward. The company’s elevated payout ratios, very low sales and earnings growth, levered balance sheet, and relatively low returns on invested capital all contributed to its low score.

Yield Score
Our Yield Score simply ranks a stock’s current dividend yield against all of the other dividend yields in the market. A score of 50 means the stock’s yield is right in the middle of the pack. A score of 100 means it has the highest yield. The Yield Score helps assess a dividend stock’s relative value.
Verizon
VZ’s Yield Score is currently 78, placing it in the top quartile of available dividend yields in the market. This is an attractive score, but it is comprised by the company’s modest growth prospects.
AT&T
T’s Yield Score is currently 83, meaning it has a higher dividend yield than 83% of all other dividend stoccks in the market. Just like VZ, the attractive yield is due in large part to limited growth prospects.
Strategic Differences
VZ’s $130 billion deal to double-down on wireless (and sell off some of its wireline assets) and T’s $49 billion deal to acquire DirecTV put the companies on different strategic paths.
While smartphone penetration is slowing after several years of outsized growth, new opportunities for growth in wireless services are emerging that VZ is banking on for future profitable growth. Tablet penetration remains under 10%, and the “Internet of Things” could provide decades of above average growth (granted it is growing off of a small base for VZ).
Data consumption will only continue skyrocketing, and VZ’s wireless network will be there to capitalize on it in some way, shape or form. Even with deflationary industry pricing, volume growth (i.e. data usage) can lead to overall sales growth.
VZ is also involved in other interesting areas of growth, like over-the-top video and content delivery (the AOL acquisition was part of this initiative, which launches this fall and benefits from the “cord cutting” movement).
While VZ is working on strengthening its core operations and looking for ways to grow as smartphone adoption continues to plateau, T diversified its business and became the largest cable TV provider in the world with its acquisition of DirecTV.
With DirecTV under its wings, T hopes to have more negotiating power with content providers and offer more bundled solutions to customers. Gaining relationships with content providers could also help the company’s ability to expand into online TV as more customers cut the cord, although we see this as much more of a risk than an opportunity.
Risks
The telecommunications industry is evolving on all fronts. Wireless subscribers are purchasing services and devices in different ways – shared data plans, buying equipment on installments, etc. – which could have longer-term implications on growth and margins. Additionally, smaller plays like Sprint and T-Mobile are trying to pressure industry pricing.
On the cable side of things, more consumers are “cutting the cord” and moving to alternative content providers like Netflix. Taking a look at DirecTV, for example, its total US subscribers increased from 19.2 million in 2010 to 20.3 million as of 6/30/15 – a 1% annualized growth rate and clear signs of saturation in the US multichannel TV market. Subscriber growth could be pressured by new entrants like Apple. It remains to be seen if T can combat this risk through bundling – a hardly innovative practice.
The cost of adding content to cable networks is also moving higher quickly, pressuring margins. T hopes to mitigate this risk by adding DirecTV’s 20 million subscribers to its existing base of 6 million TV subscribers. While this helps T, the overall math doesn’t change much – DirecTV already had good leverage with programmers – and T’s existing U-verse TV operations were just a small portion of the overall company’s sales.
Regulations are also a risk and cut both ways – acquiring spectrum and building out a network are very, very expensive endeavors, keeping smaller players out and forming an oligopoly, but issues like net neutrality could pose risk to the industry’s margins if they are deemed excessive. Thus a generally stable, moderately profitable, low growth business is born.
Valuation
VZ trades at 12x forward earnings estimates, and T trades at 13x forward earnings estimates. From a dividend yield perspective, T looks slightly cheaper with an 83 Yield Score compared to VZ’s 78 Yield Score. Given both company’s lower prospects for growth, it isn’t surprising to see them trading at cheaper yields and multiples compared to the market.
However, given their similarities in valuation, we prefer VZ over T at this time.
Conclusion
T and VZ are appropriate for income-seeking dividend investors, but long-term dividend growth investors should steer clear – think of these stocks more like bonds. However, with T and VZ heading in different strategic directions, their future total returns could ultimately be very different than they were over the past decade. We believe VZ’s wireless assets pose less risk and more long-term growth opportunity than T’s foray into bundled cable.
Don’t be late to the party – Click Here to see what 4500 Wall Street Analysts say about your stocks.
The post Verizon Communications Inc. (VZ) Versus AT&T Inc. (T): Complete Comparison appeared first on Smarter Analyst.